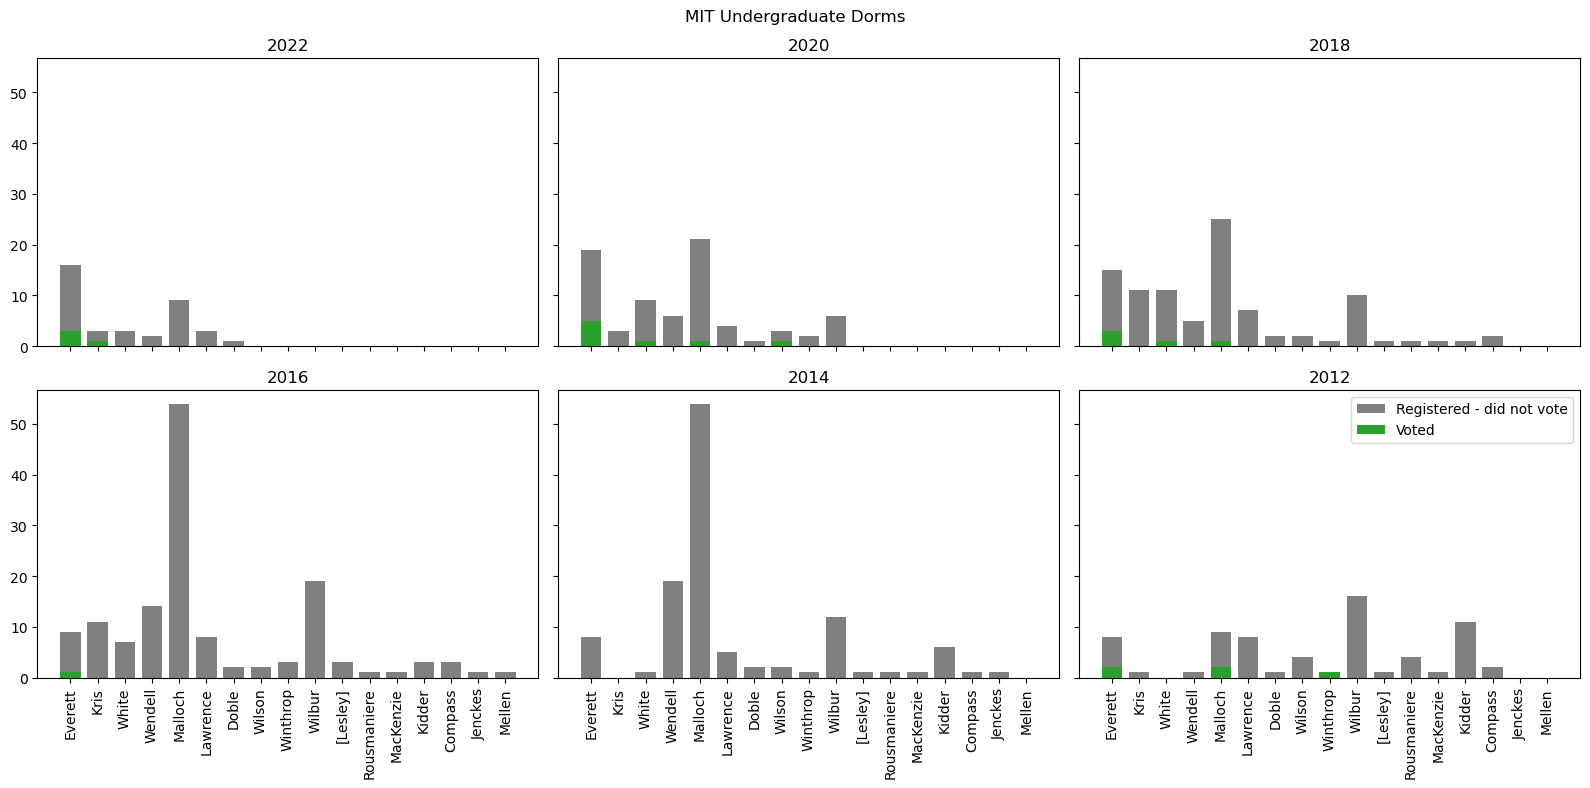
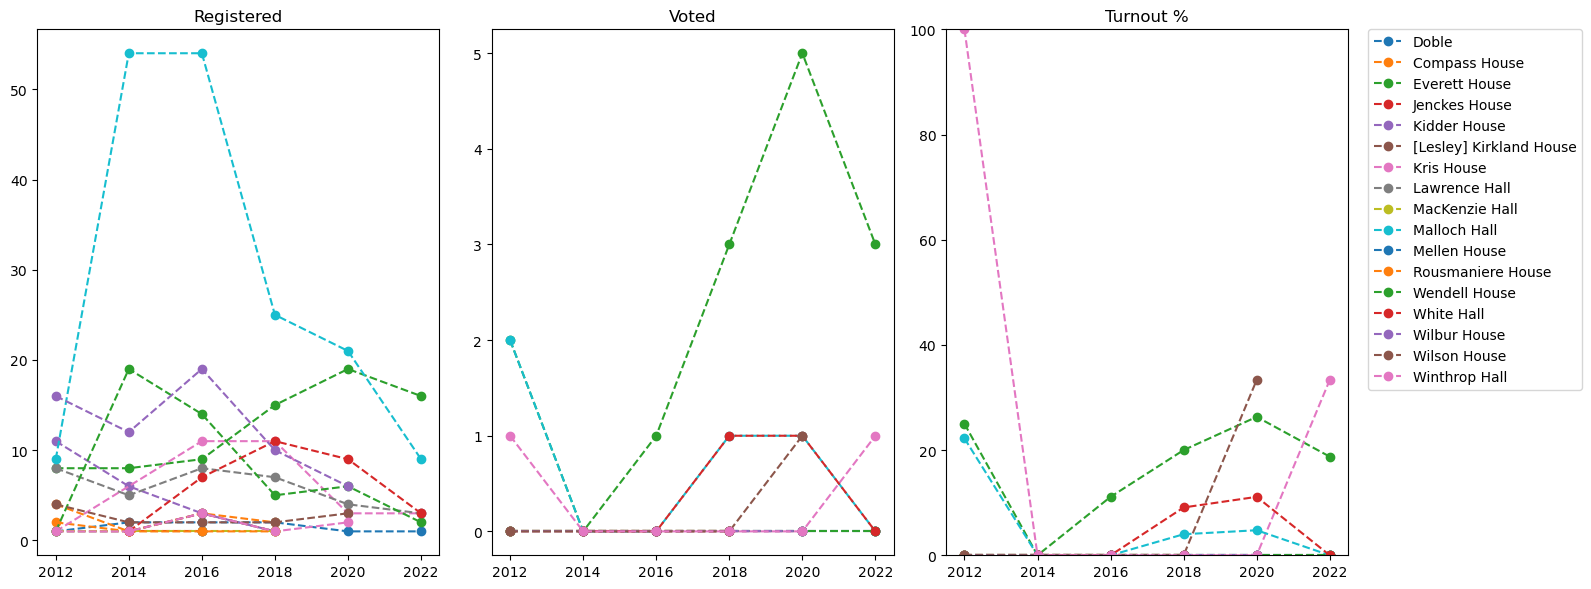
University Housing - Primaries#
An investigation of voter turnout in September Primary Elections
Harvard College#
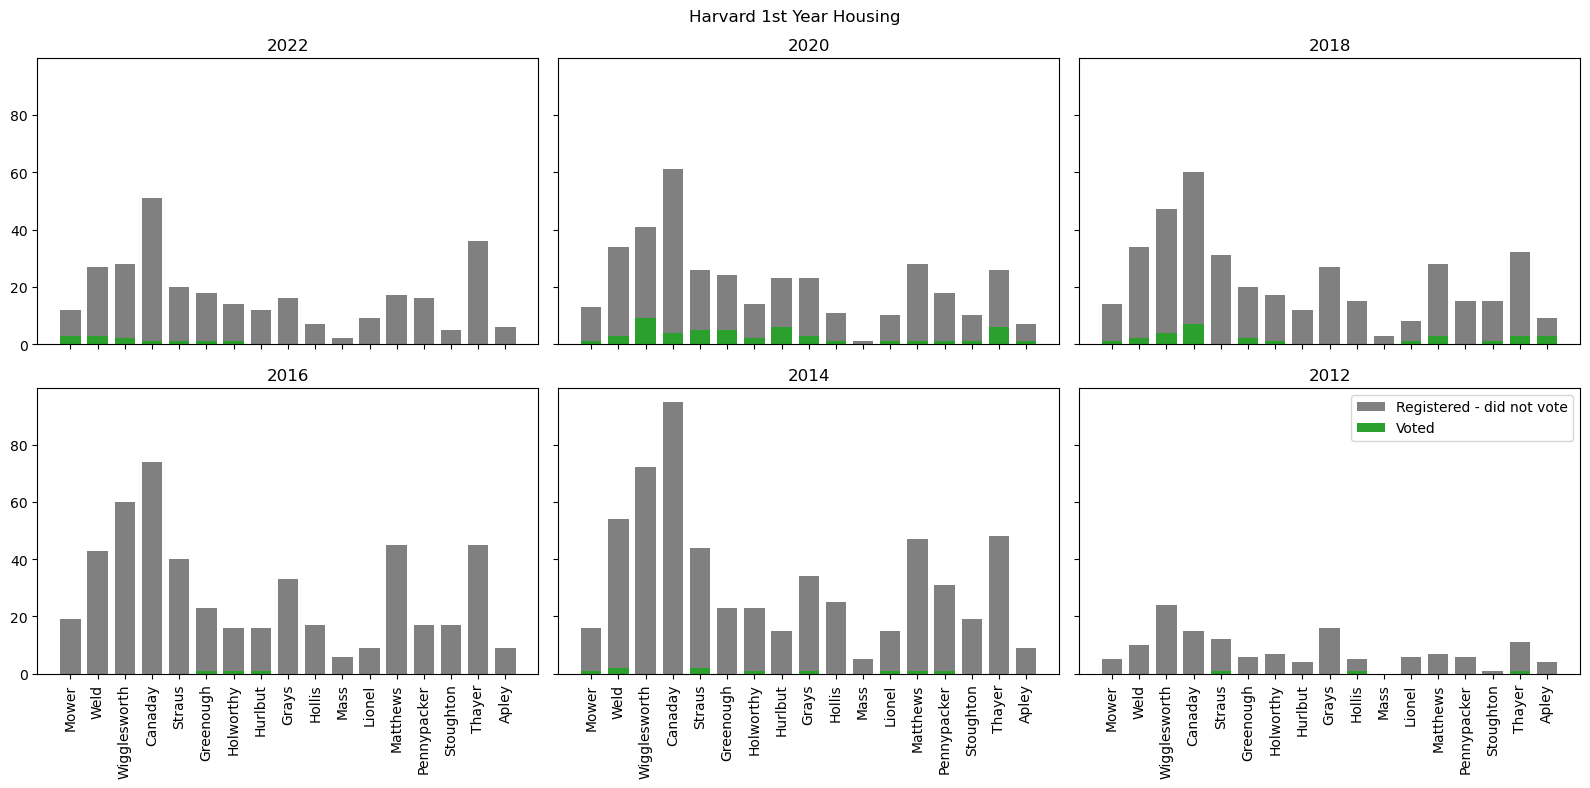
Harvard First Year Houses#
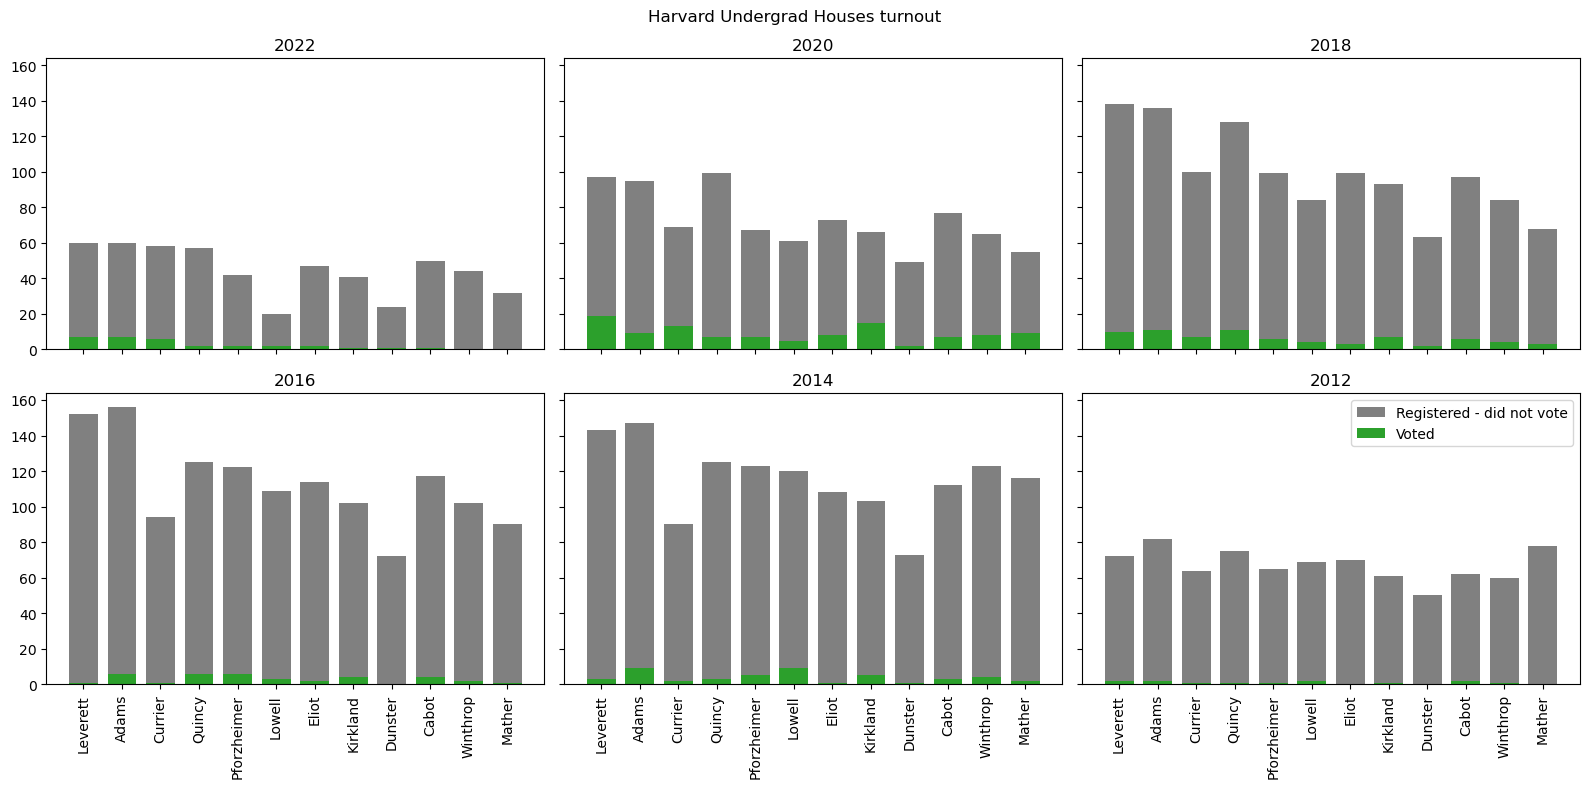
Harvard Undergraduate Houses#
Harvard Grad Dorms#
Harvard University Housing#
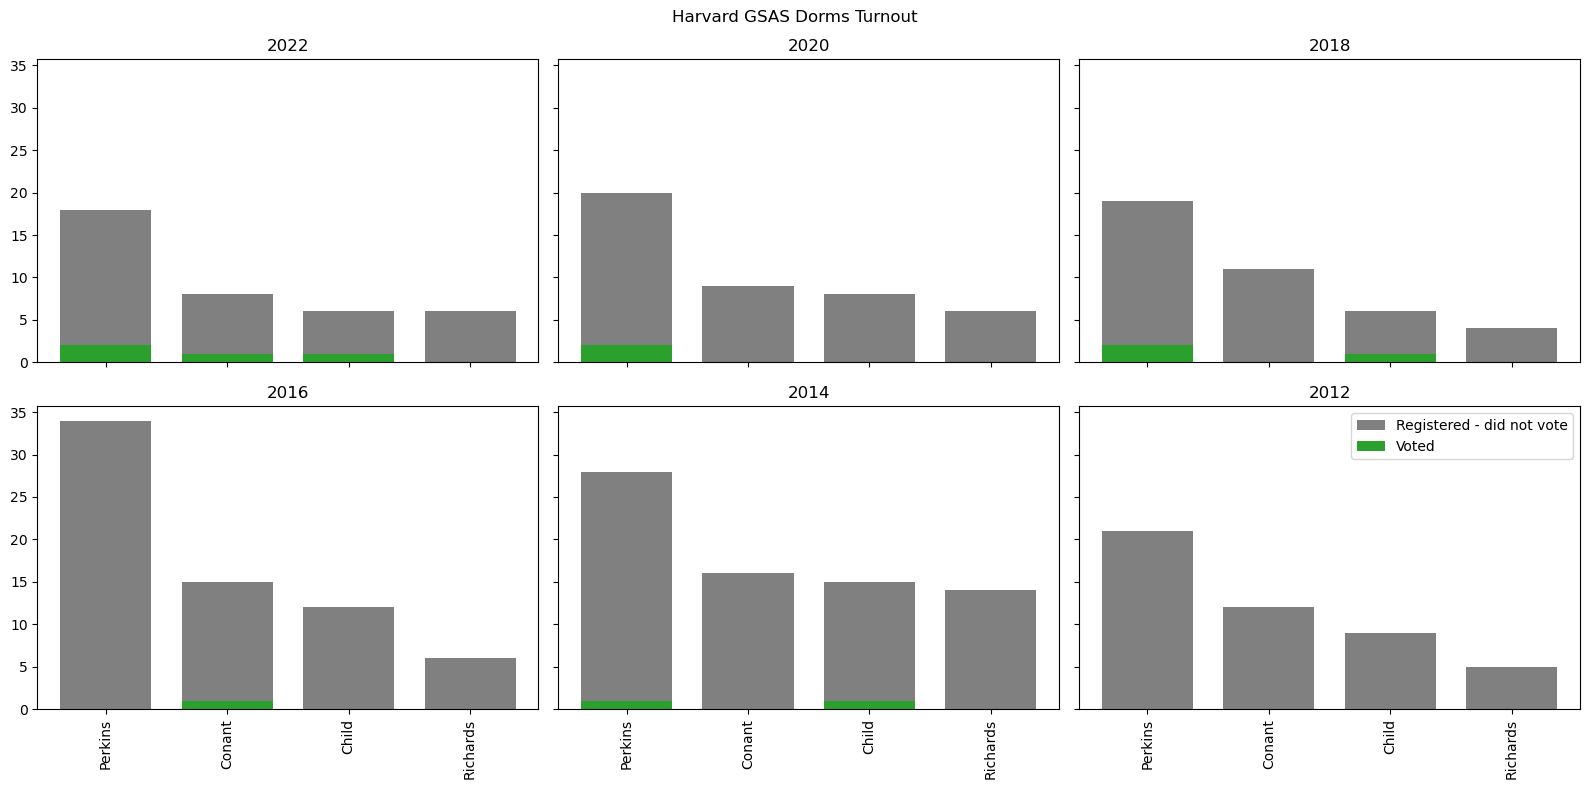
Harvard University Housing is separate from the grad dorms and undergrad house system. They rent out apartments to graduate students. A map of their properties can be found here
Every Harvard Housing property in Cambridge is the 25th Middlesex State House District.
Harvard Law School Dorms#
All Harvard Dorms/Housing#
Harvard Undergraduate Total turnout#
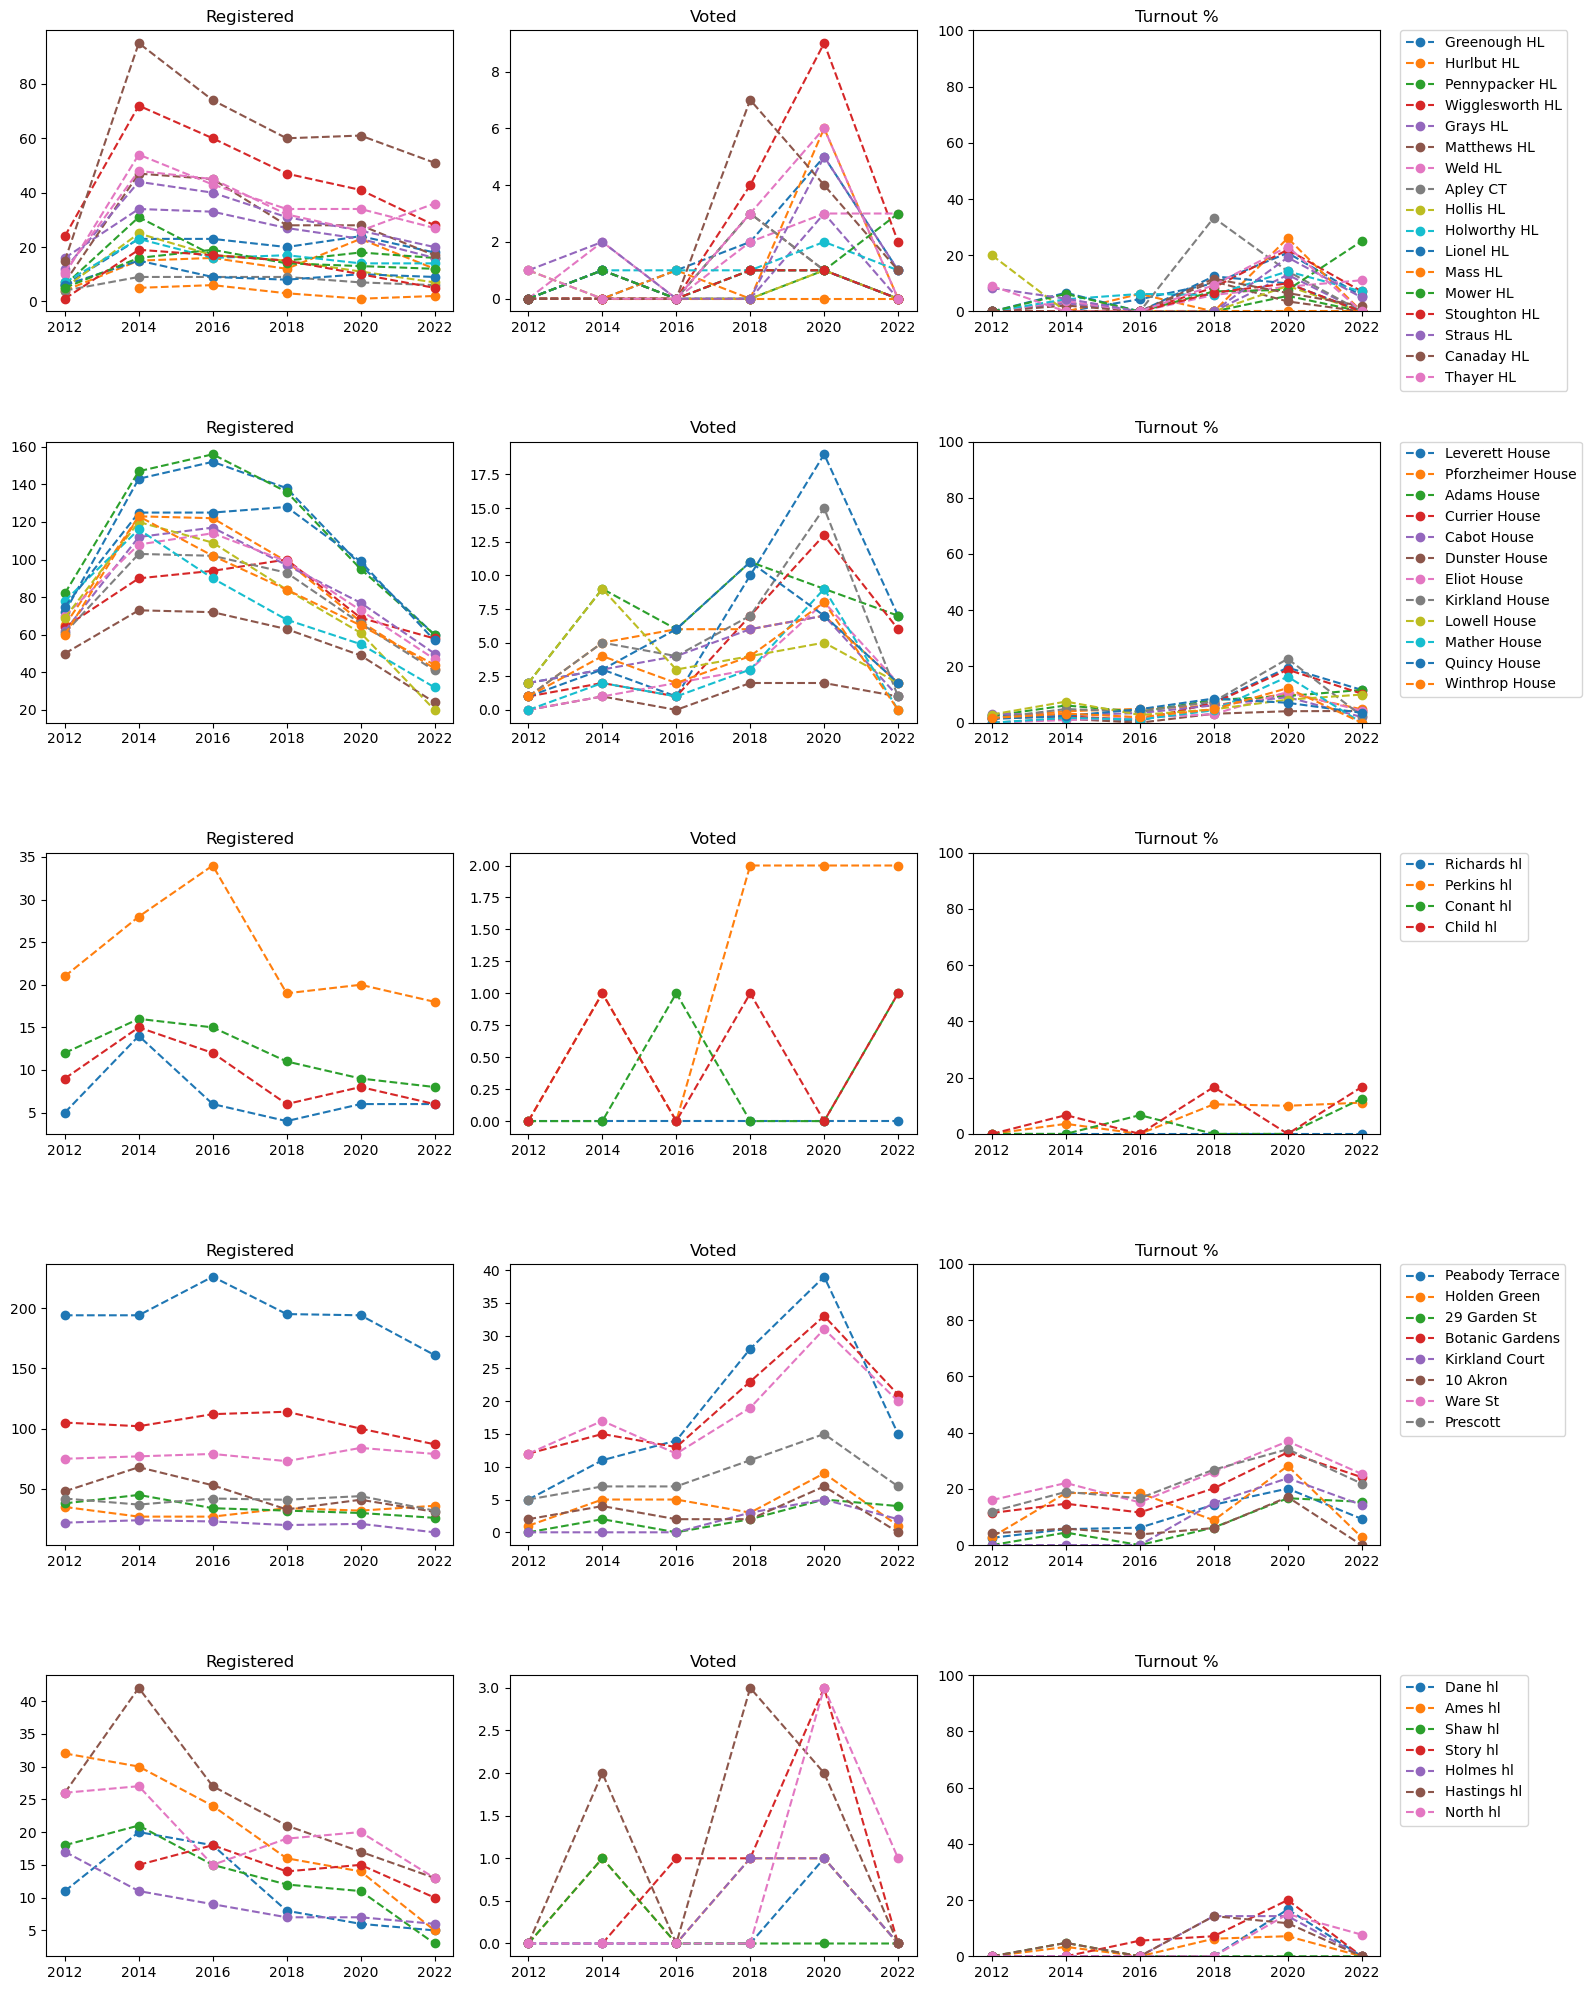
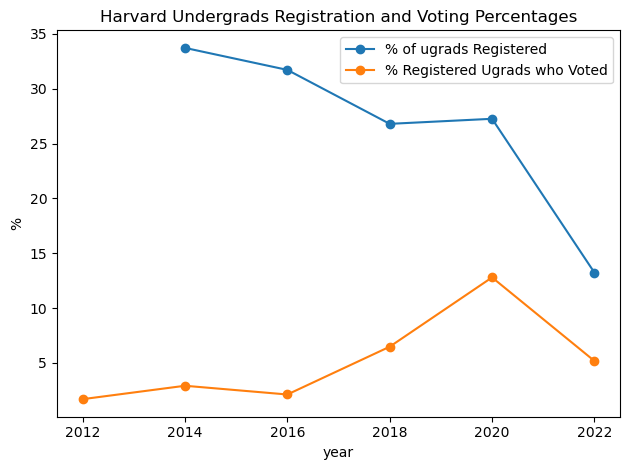
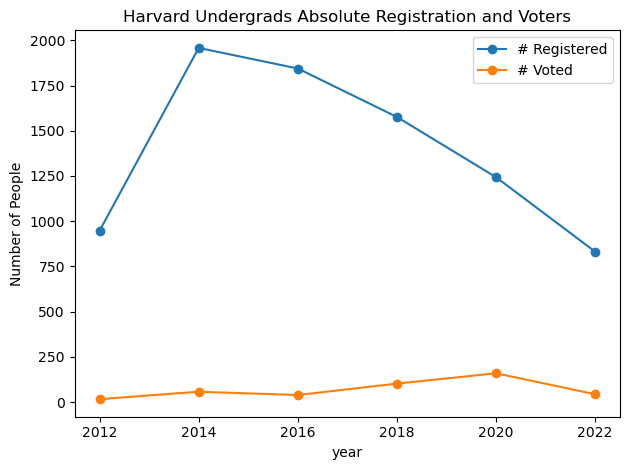
Because the harvard undegraduate population nearly entirely lives in the house system we can assess the turnout of Harvard Undergraduates as a whole based on the enrollment numbers available from the Harvard Factbook.
Unfortunately the breakdown of international or US citizen is currently only available for 2022/2023. But based on some very cursory googling it seem that each year has 10-15% international enrollment. So for the following analysis we will assume 12.5% international undergraduates at Harvard.
The big takeaway here is that Harvard Undergraduates have barely voted in any state level primaries over the past decade.
| voted | registered | turnout % | enrollment | us-citizens | registered-percent | |
|---|---|---|---|---|---|---|
| year | ||||||
| 2012 | 16 | 947 | 1.689546 | NaN | NaN | NaN |
| 2014 | 57 | 1958 | 2.911134 | 6636.0 | 5806.500 | 33.720830 |
| 2016 | 39 | 1844 | 2.114967 | 6645.0 | 5814.375 | 31.714501 |
| 2018 | 102 | 1576 | 6.472081 | 6722.0 | 5881.750 | 26.794746 |
| 2020 | 159 | 1243 | 12.791633 | 5212.0 | 4560.500 | 27.255783 |
| 2022 | 43 | 831 | 5.174489 | 7178.0 | 6280.750 | 13.230904 |
MIT#
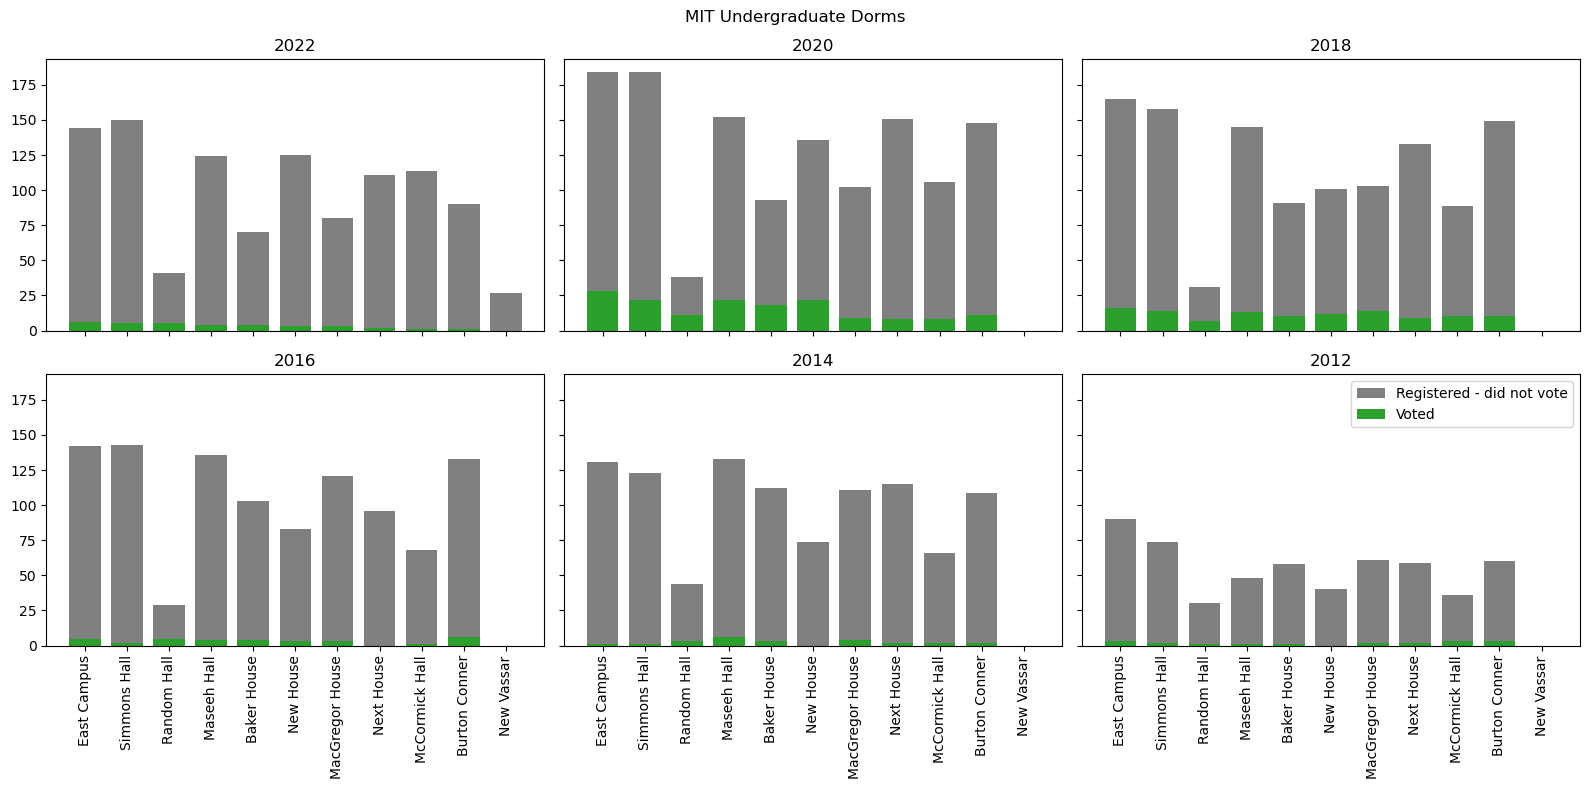
MIT Undergraduate Dorms#
primary[mit_ugrad_idx["all"]]["State Representative District"].unique()
array([191, 143, 201, 185])
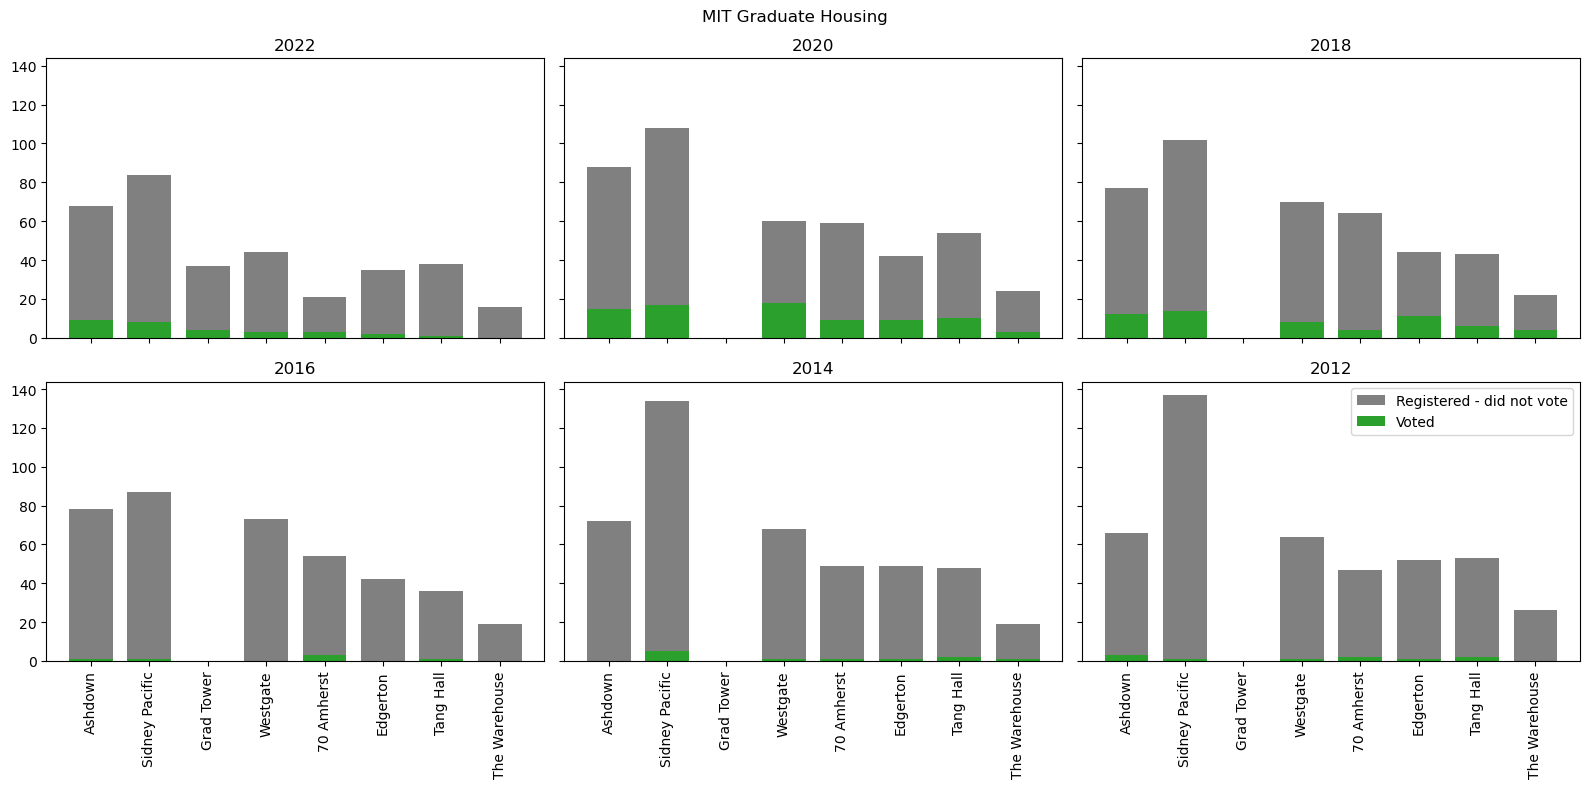
MIT Graduate Housing#
All MIT Dorms/Housing#
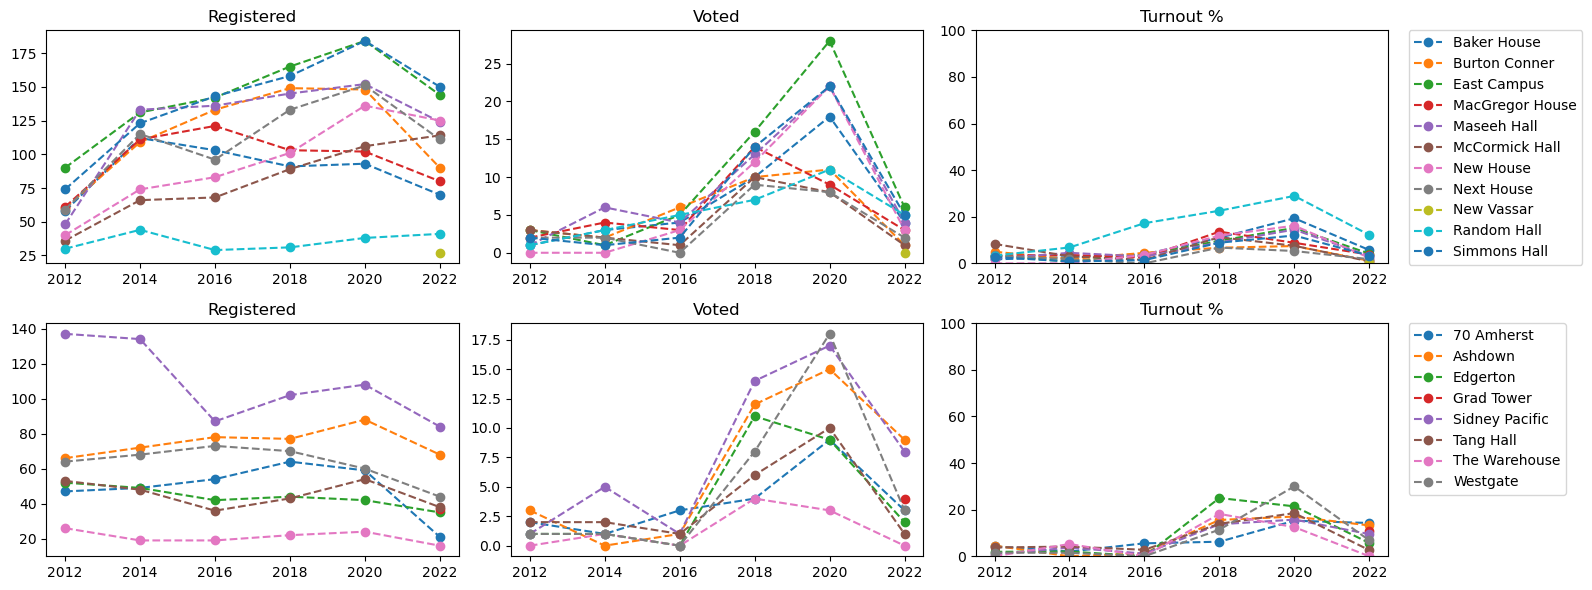
MIT Undergraduate Total turnout#
TODO
This should be possible to calculate using the information from https://registrar.mit.edu/statistics-reports/enrollment-statistics-year# But has yet to be implemented here.
Lesley#
We cannot calculate total turnout of Lesley students as not all students live on campus (78% of first years per https://lesley.edu/life-at-lesley/campus-life/housing). So we cannot calculate the correct percentage of international students who live in the dorms.
Lesley Undergraduates#
