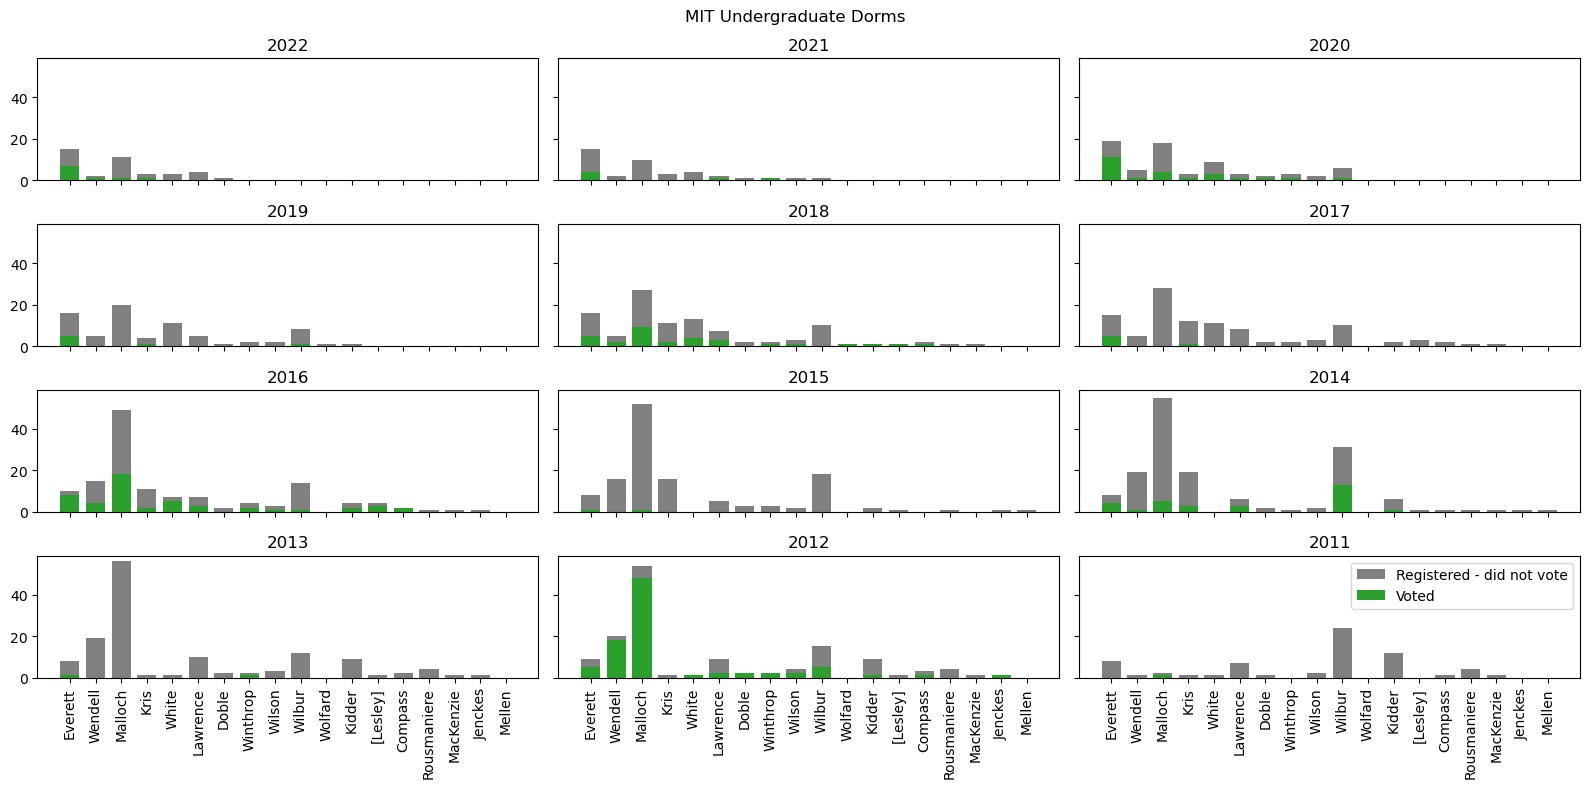
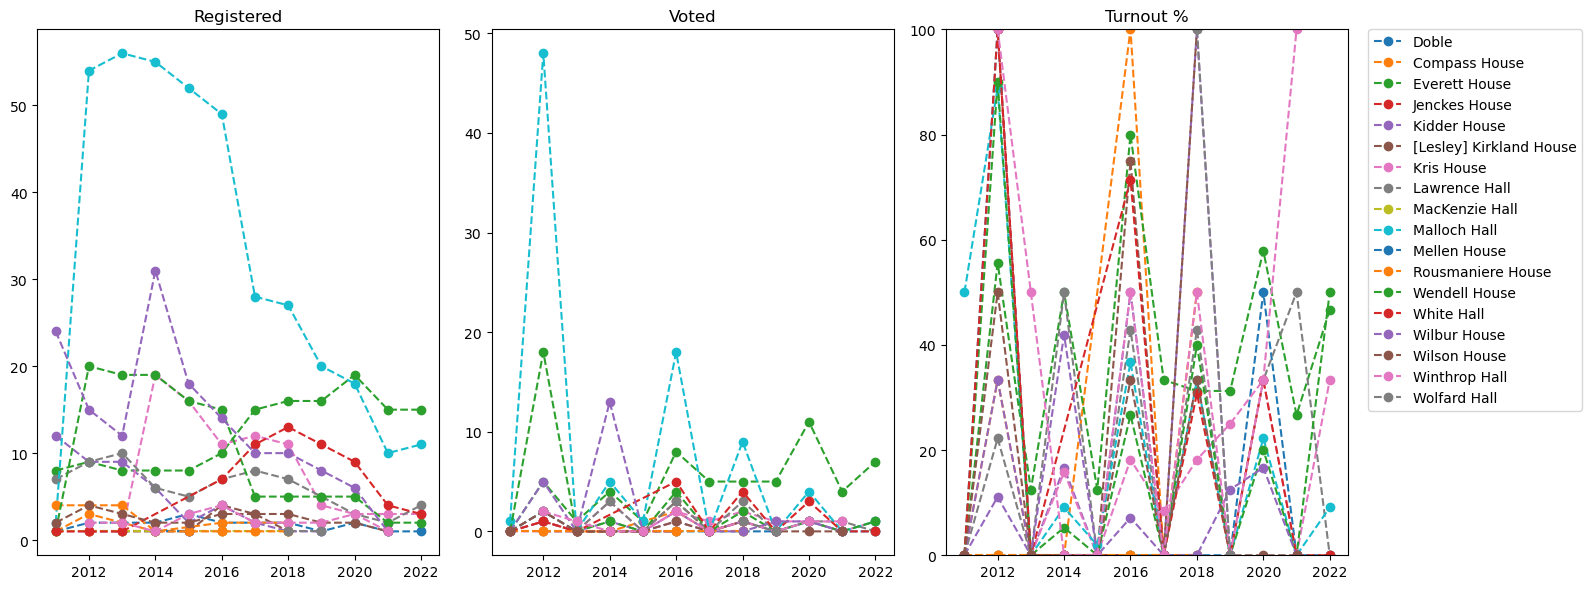
University Housing Turnout#
Cambridge is home to three Universities (in order of total enrollment): Harvard, MIT, Lesley
Harvard College#
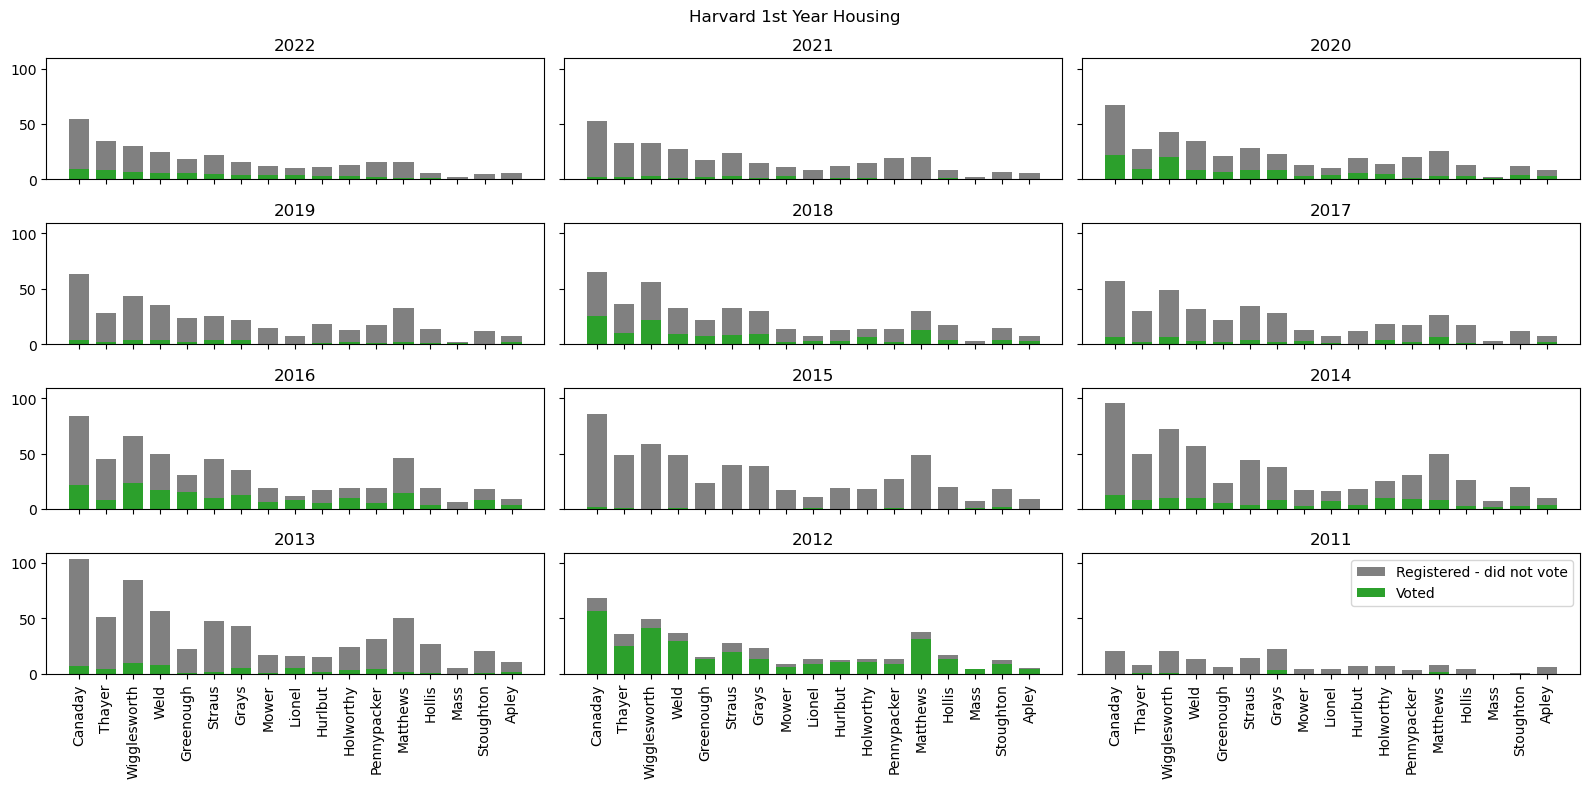
Harvard First Year Houses#
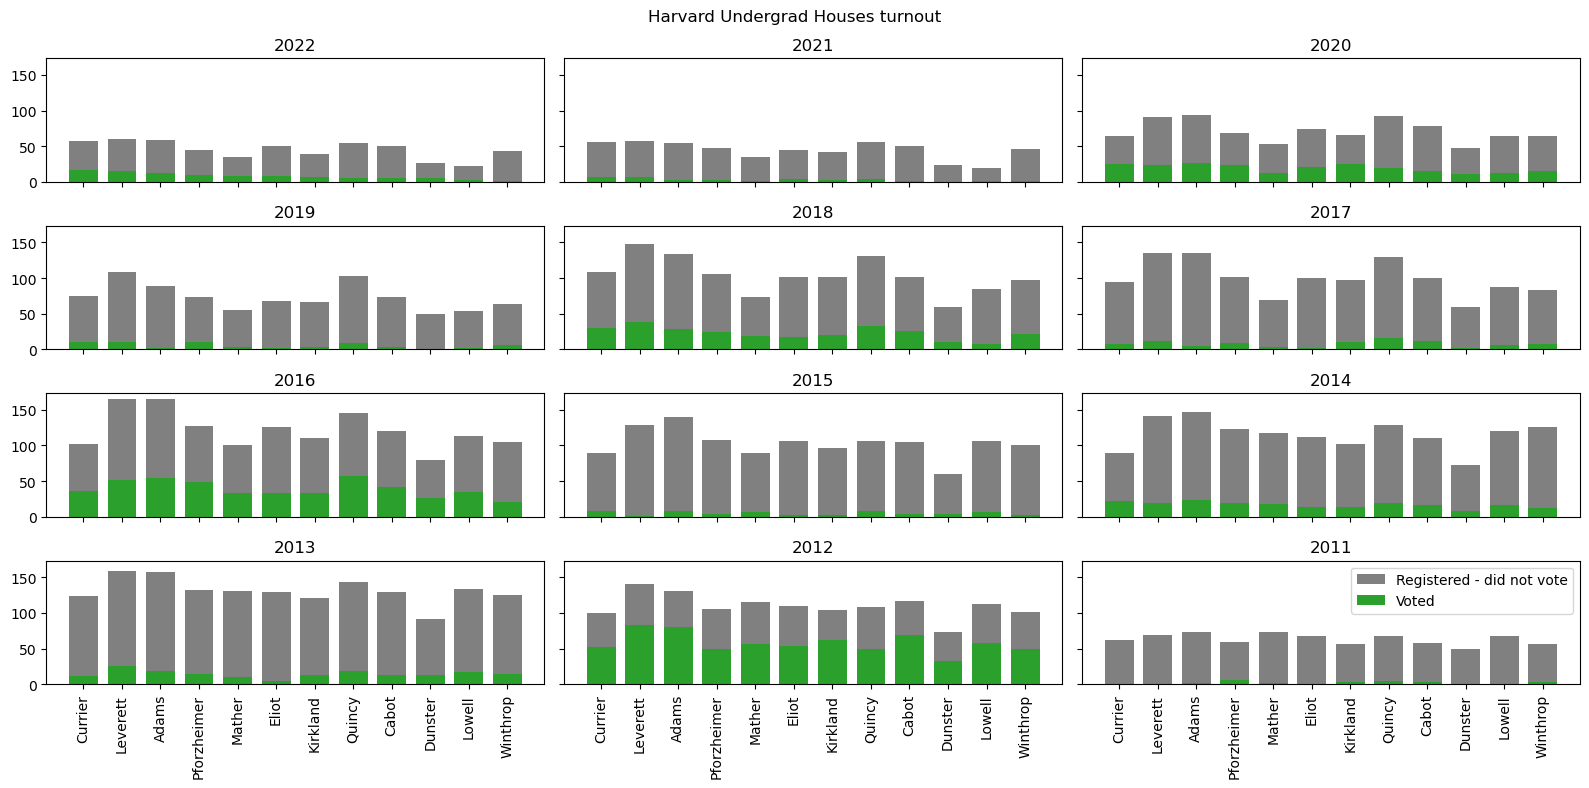
Harvard Undergraduate Houses#
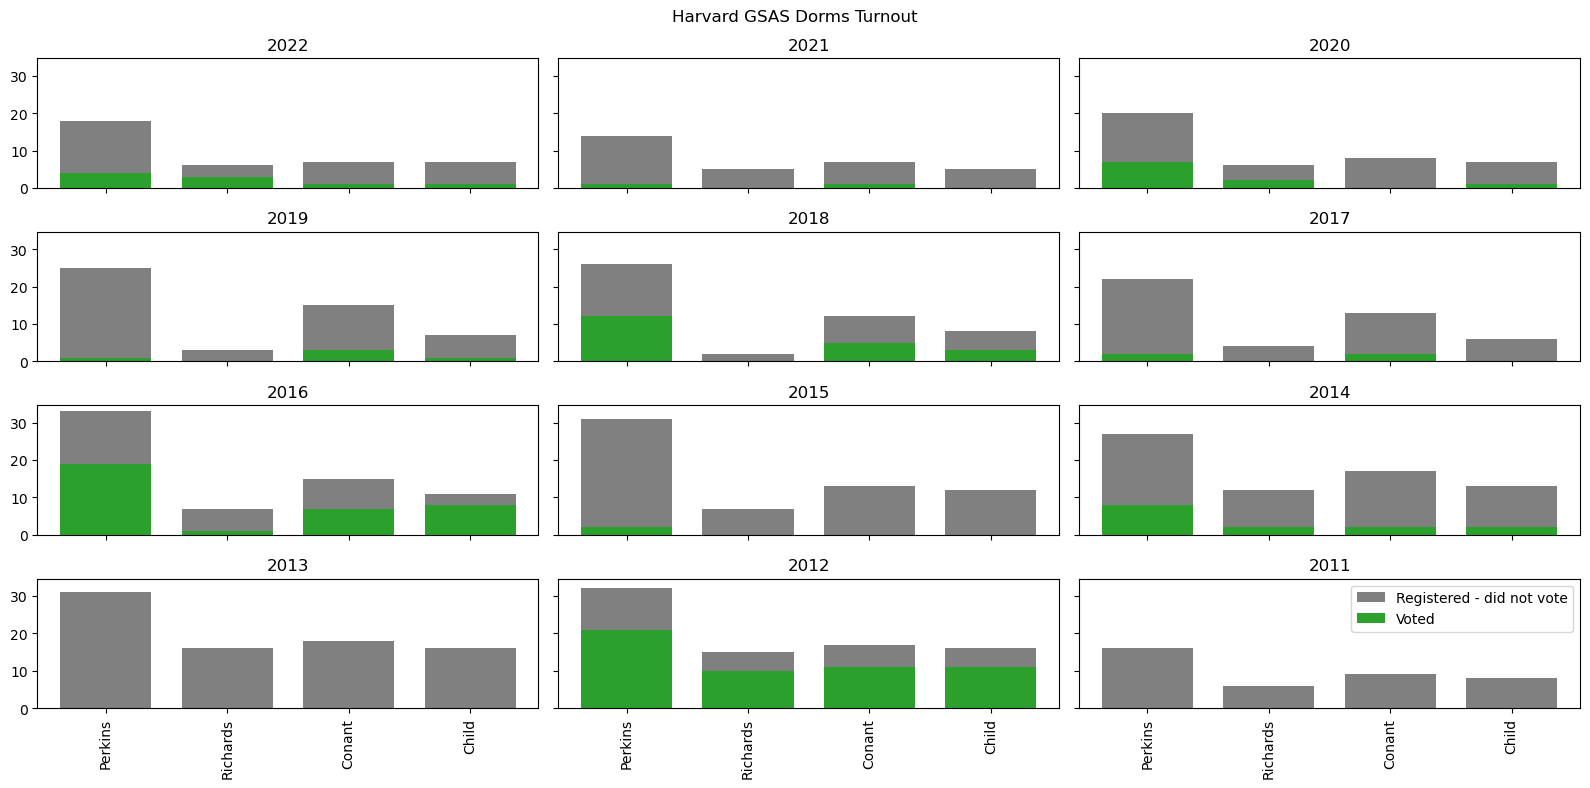
Harvard Grad Dorms#
Harvard University Housing#
Harvard University Housing is separate from the grad dorms and undergrad house system. They rent out apartments to graduate students. A map of their properties can be found here

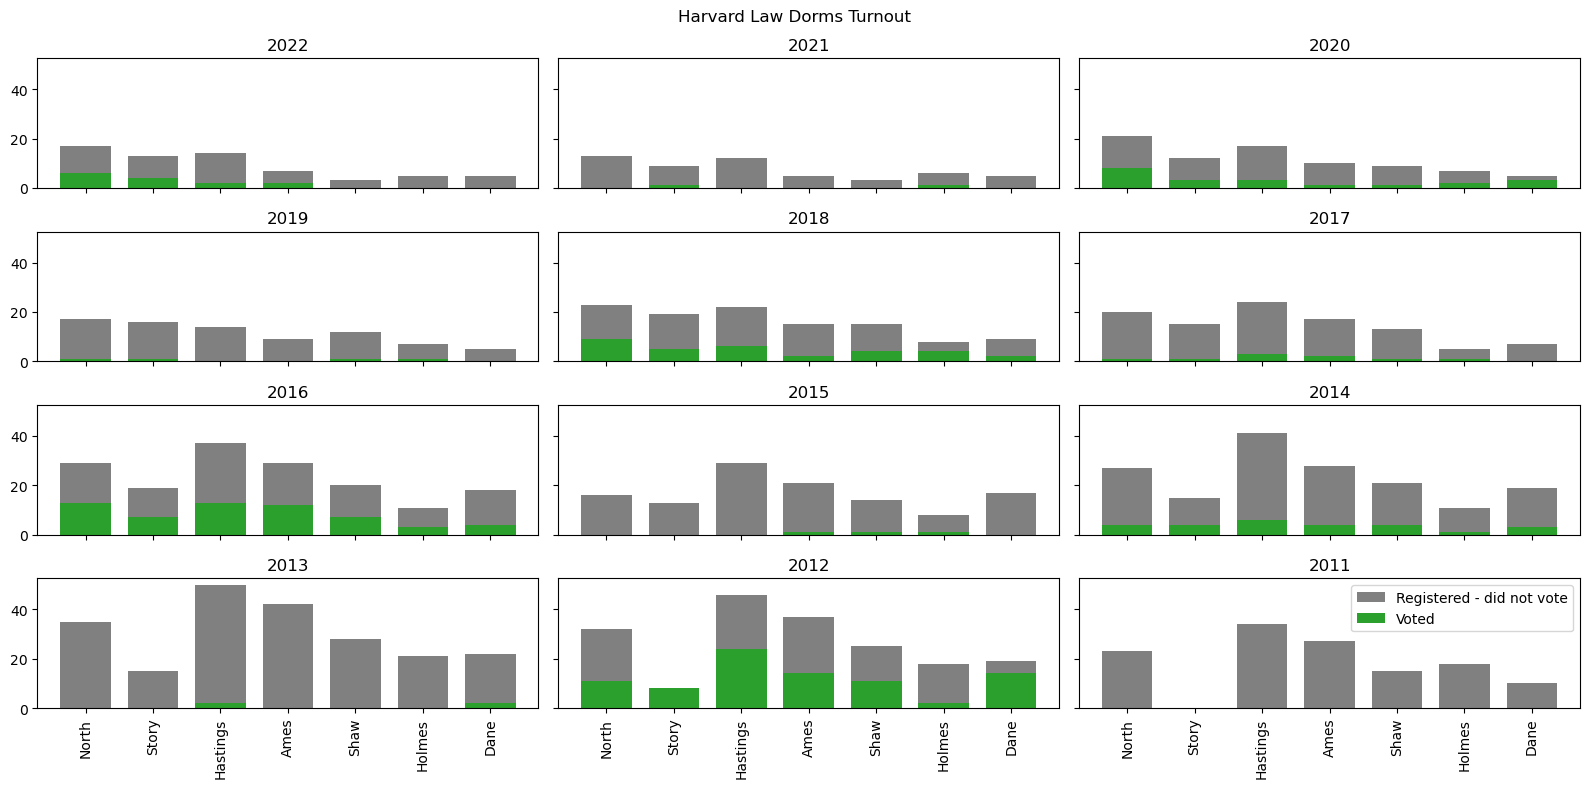
Harvard Law School Dorms#
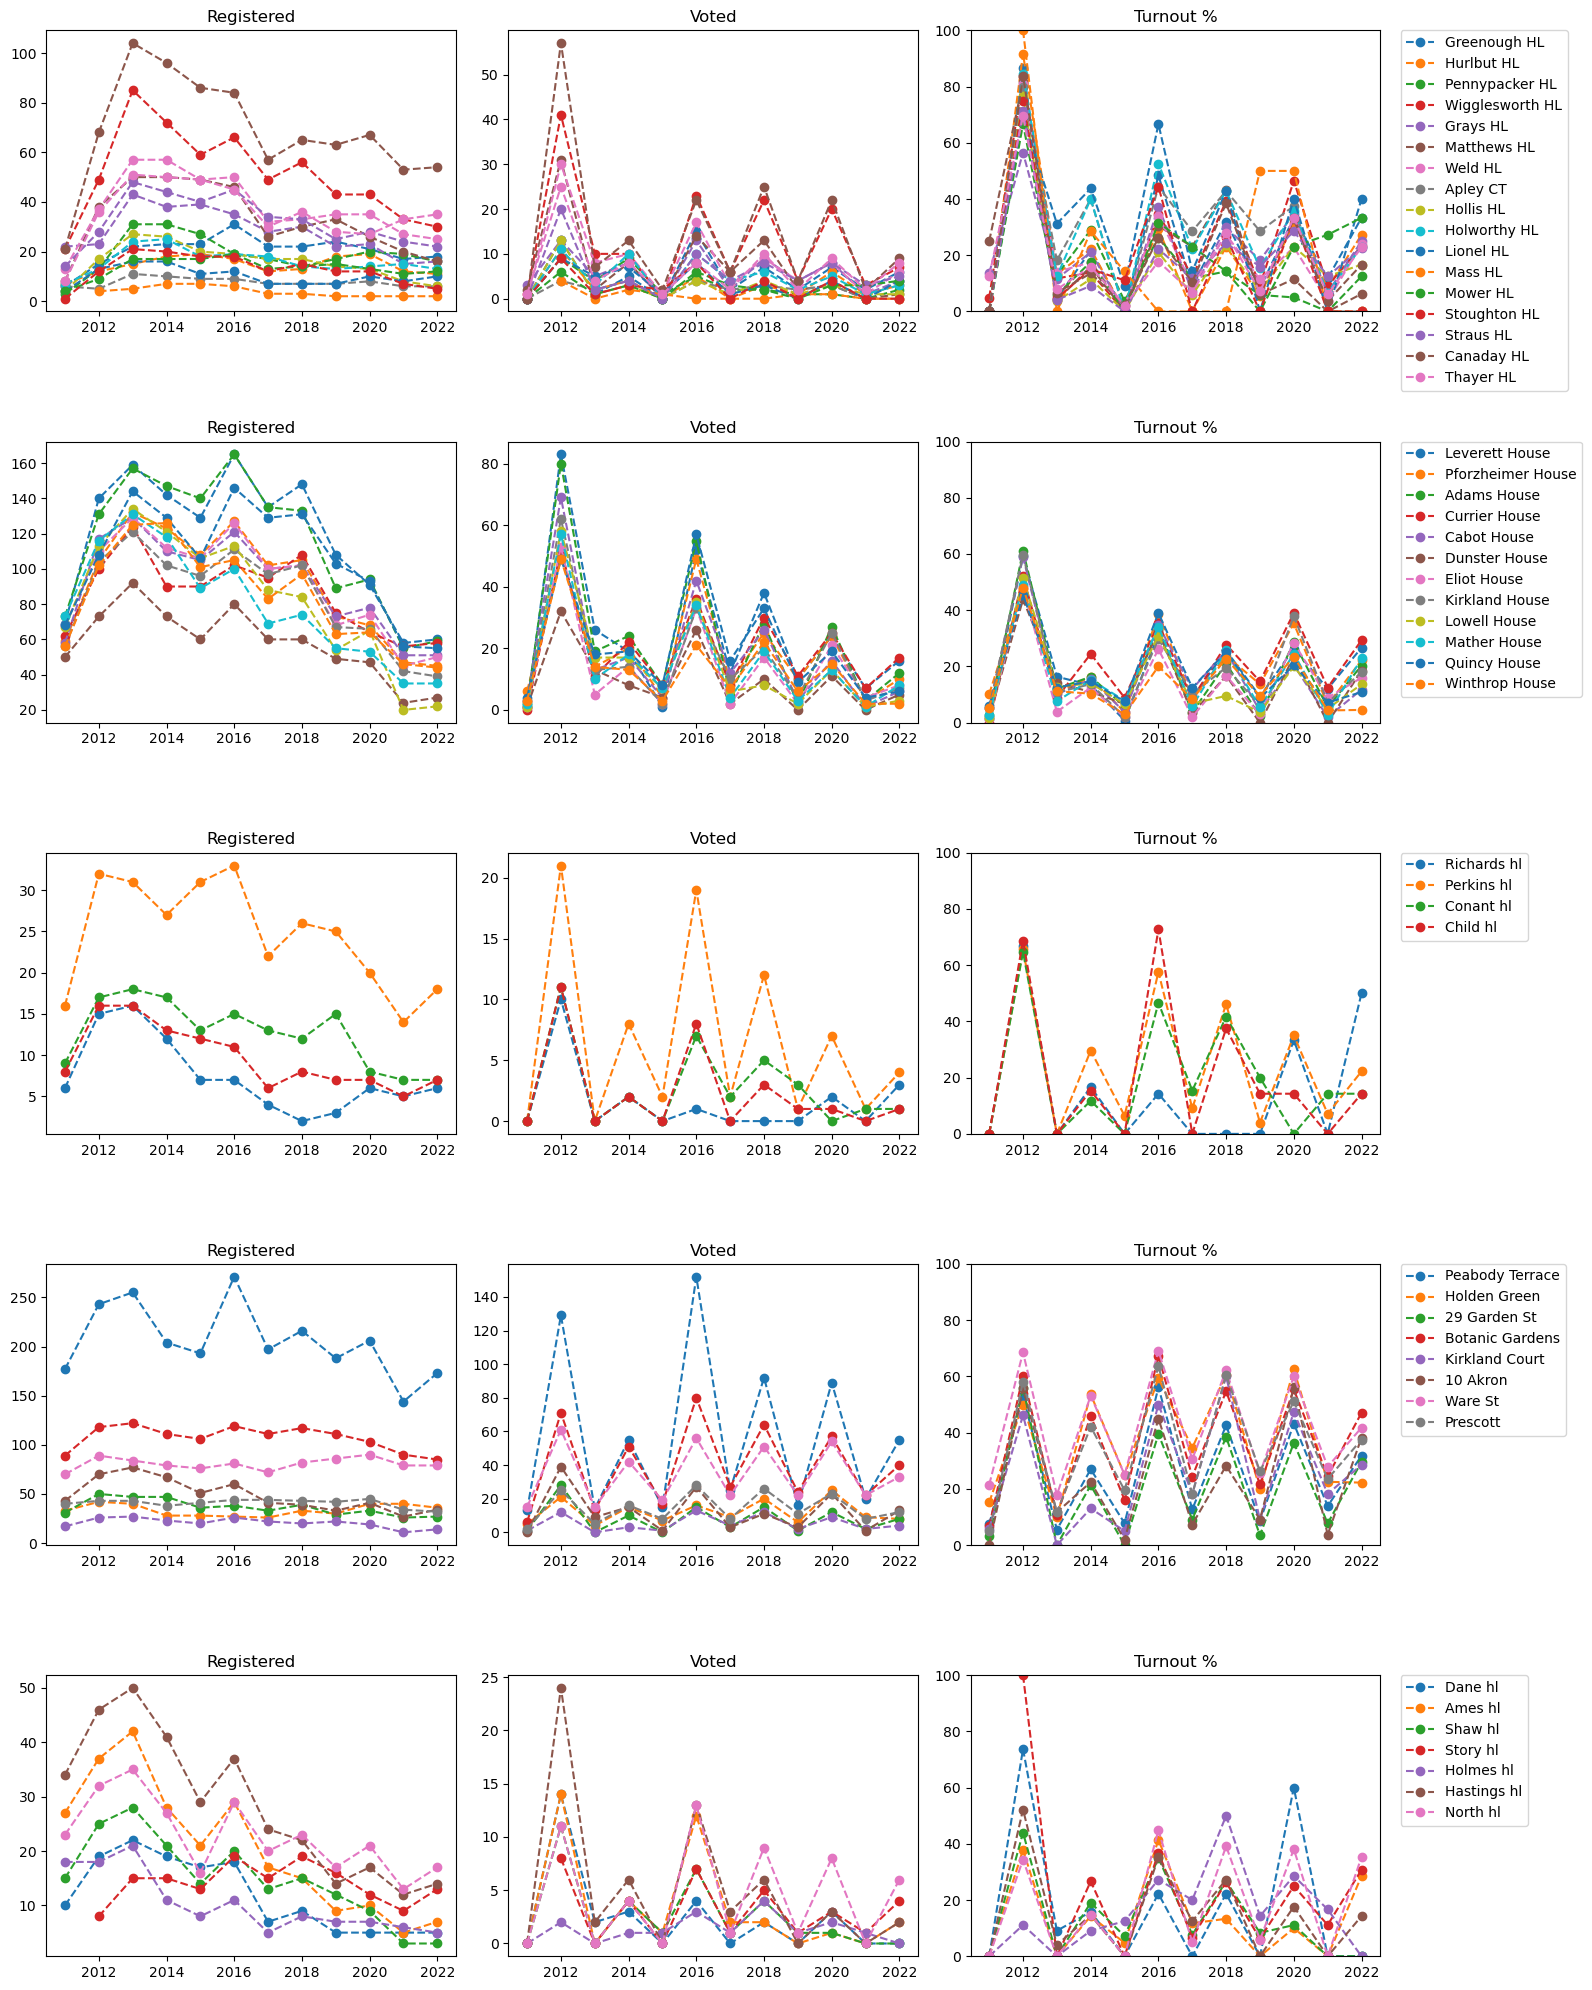
All Harvard Dorms/Housing#
Harvard Undergraduate Total turnout#
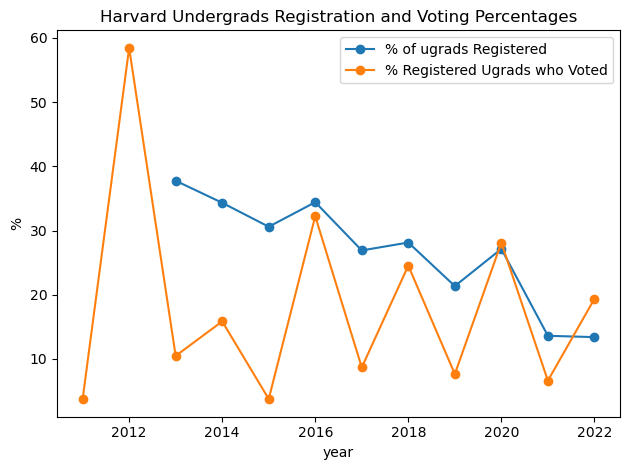
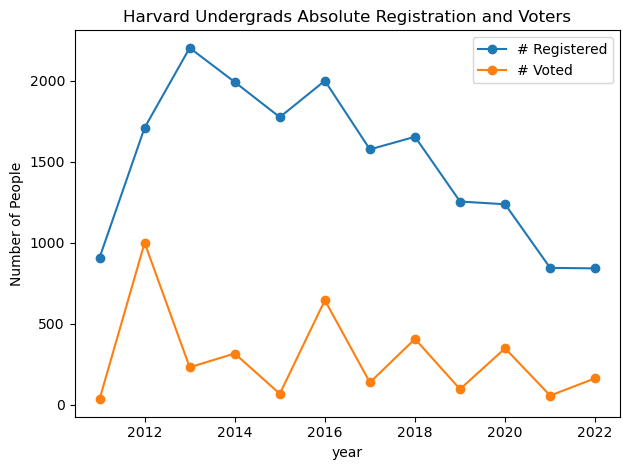
Because the harvard undegraduate population nearly entirely lives in the house system we can assess the turnout of Harvard Undergraduates as a whole based on the enrollment numbers available from the Harvard Factbook.
Unfortunately the breakdown of international or US citizen is currently only available for 2022/2023. But based on some very cursory googling it seem that each year has 10-15% international enrollment. So for the following analysis we will assume 12.5% international undergraduates at Harvard.
The big takeaway here is that Harvard Undergraduate Registration numbers have steadily declined over the past decade, down to a paltry 13% of eligible Harvard undergraduates having registered to vote. However, due to fluctuations in enrollment size and turnout percent the number of Harvard undergraduates who vote has remained at the same (low) level.
| voted | registered | turnout | enrollment | us-citizens | registered-percent | |
|---|---|---|---|---|---|---|
| year | ||||||
| 2011 | 34 | 908 | 0.037445 | NaN | NaN | NaN |
| 2012 | 1000 | 1711 | 0.584454 | NaN | NaN | NaN |
| 2013 | 231 | 2204 | 0.104809 | 6671.0 | 5837.125 | 0.377583 |
| 2014 | 316 | 1993 | 0.158555 | 6636.0 | 5806.500 | 0.343236 |
| 2015 | 67 | 1776 | 0.037725 | 6634.0 | 5804.750 | 0.305956 |
| 2016 | 645 | 2001 | 0.322339 | 6645.0 | 5814.375 | 0.344147 |
| 2017 | 137 | 1577 | 0.086874 | 6699.0 | 5861.625 | 0.269038 |
| 2018 | 406 | 1655 | 0.245317 | 6722.0 | 5881.750 | 0.281379 |
| 2019 | 96 | 1255 | 0.076494 | 6716.0 | 5876.500 | 0.213562 |
| 2020 | 348 | 1238 | 0.281099 | 5212.0 | 4560.500 | 0.271461 |
| 2021 | 56 | 845 | 0.066272 | 7095.0 | 6208.125 | 0.136112 |
| 2022 | 163 | 842 | 0.193587 | 7178.0 | 6280.750 | 0.134060 |
MIT#
MIT Undergraduate Dorms#
MIT Graduate Housing#

All MIT Dorms/Housing#
MIT Undergraduate Total turnout#
TODO
This should be possible to calculate using the information from https://registrar.mit.edu/statistics-reports/enrollment-statistics-year# But has yet to be implemented here.
Lesley#
We cannot calculate total turnout of Lesley students as not all students live on campus (78% of first years per https://lesley.edu/life-at-lesley/campus-life/housing). So we cannot calculate the correct percentage of international students who live in the dorms.
Lesley Undergraduates#
